As noted in Exploring house sales and the impact of EWS1 forms for building fire safety, I am a high rise block leaseholder with experience managing a residential block of 137 apartments. Through these experiences I’ve come to learn the challenges and opportunities to improve tenant and leaseholder experience – helping tenants to have a better experience living at a block and leaseholders to optimise their property investment(s).
As part of my continued personal development outside of work, I’ve been researching PropTech companies, particularly around two areas I am passionate about:
- Block management to improve the running of residential developments
- Experiential products to helping improve the experience of owning, investing and/or living at leaseholder blocks
HomeViews is one such PropTech who claim to be an “independent review platform for residential developments”. Their goal is to be the Tripadvisor of Residential Developments. Curious to learn more about the potential of such use cases and products, and their applicability to my own block I set myself the personal challenge of understanding how HomeViews works and the type of data that home owners and tenants are sharing on the site.
This post explores the site’s review data and what that data tells us. If there is sufficient interest I will write another post on the site’s use cases and product features I discovered through my research, and my evaluation of whether the current product iteration meets the companies stated goals of providing a non-bias, independent review platform.
This ongoing project is intended for personal use only, and I share insights here to illustrate my product and technical skills, problem solving and thought leadership. All information shared is at an aggregate level and to protect the original submitter‘s data no individual reviews are included in my analysis. For the latest data I recommend you to check out HomeViews website directly rather than to rely on any data in these dashboards.
Please expand each section to learn more about my product discovery approach, outputs and learnings.
Capturing review data to analyse
Inspecting the HomeViews website I found the site contains the following types of data (amongst others):
- Developer – A page listing all developers. Each developer links to a page about each developer which lists details about the developer, with a map listing each development they have built.
- Development – Each development listed on the developer page links to a page about each development.
- Reviews – a paginated list of all detailed reviews for the development – linked from the developer page.
- Facilities – a list of facilities at that development are detailed on the development page.
In order to analyse the content of the site first I needed to collect data. Enter Alteryx. Alteryx is an ETL tool – which stands for Extract, Transform and Load. After inspecting the HTML templates on the developer list, developer and development pages I was able to crawl the site and extract the content of each page using Alteryx. By creating custom filters and data transformations I was able to automatically parse and cleanse the content and then store it in a structured data form – with linked records for Developer details, Development details, Reviews and Facilities. Crawling, extracting and parsing the entire site took the Alteryx script around 30 minutes and resulted in over 18,000 records to analyse.
Visualising the review data
Taking the residential review data I was able to quickly visualise and explore it in Tableau. You can preview the full dashboard on my Tableau Public Gallery. This dashboard utilises the best practices user experience and data insights I’ve developed in my day job at CBRE when creating interactive data experiences for client pitches. For now I focused on two views of the data:
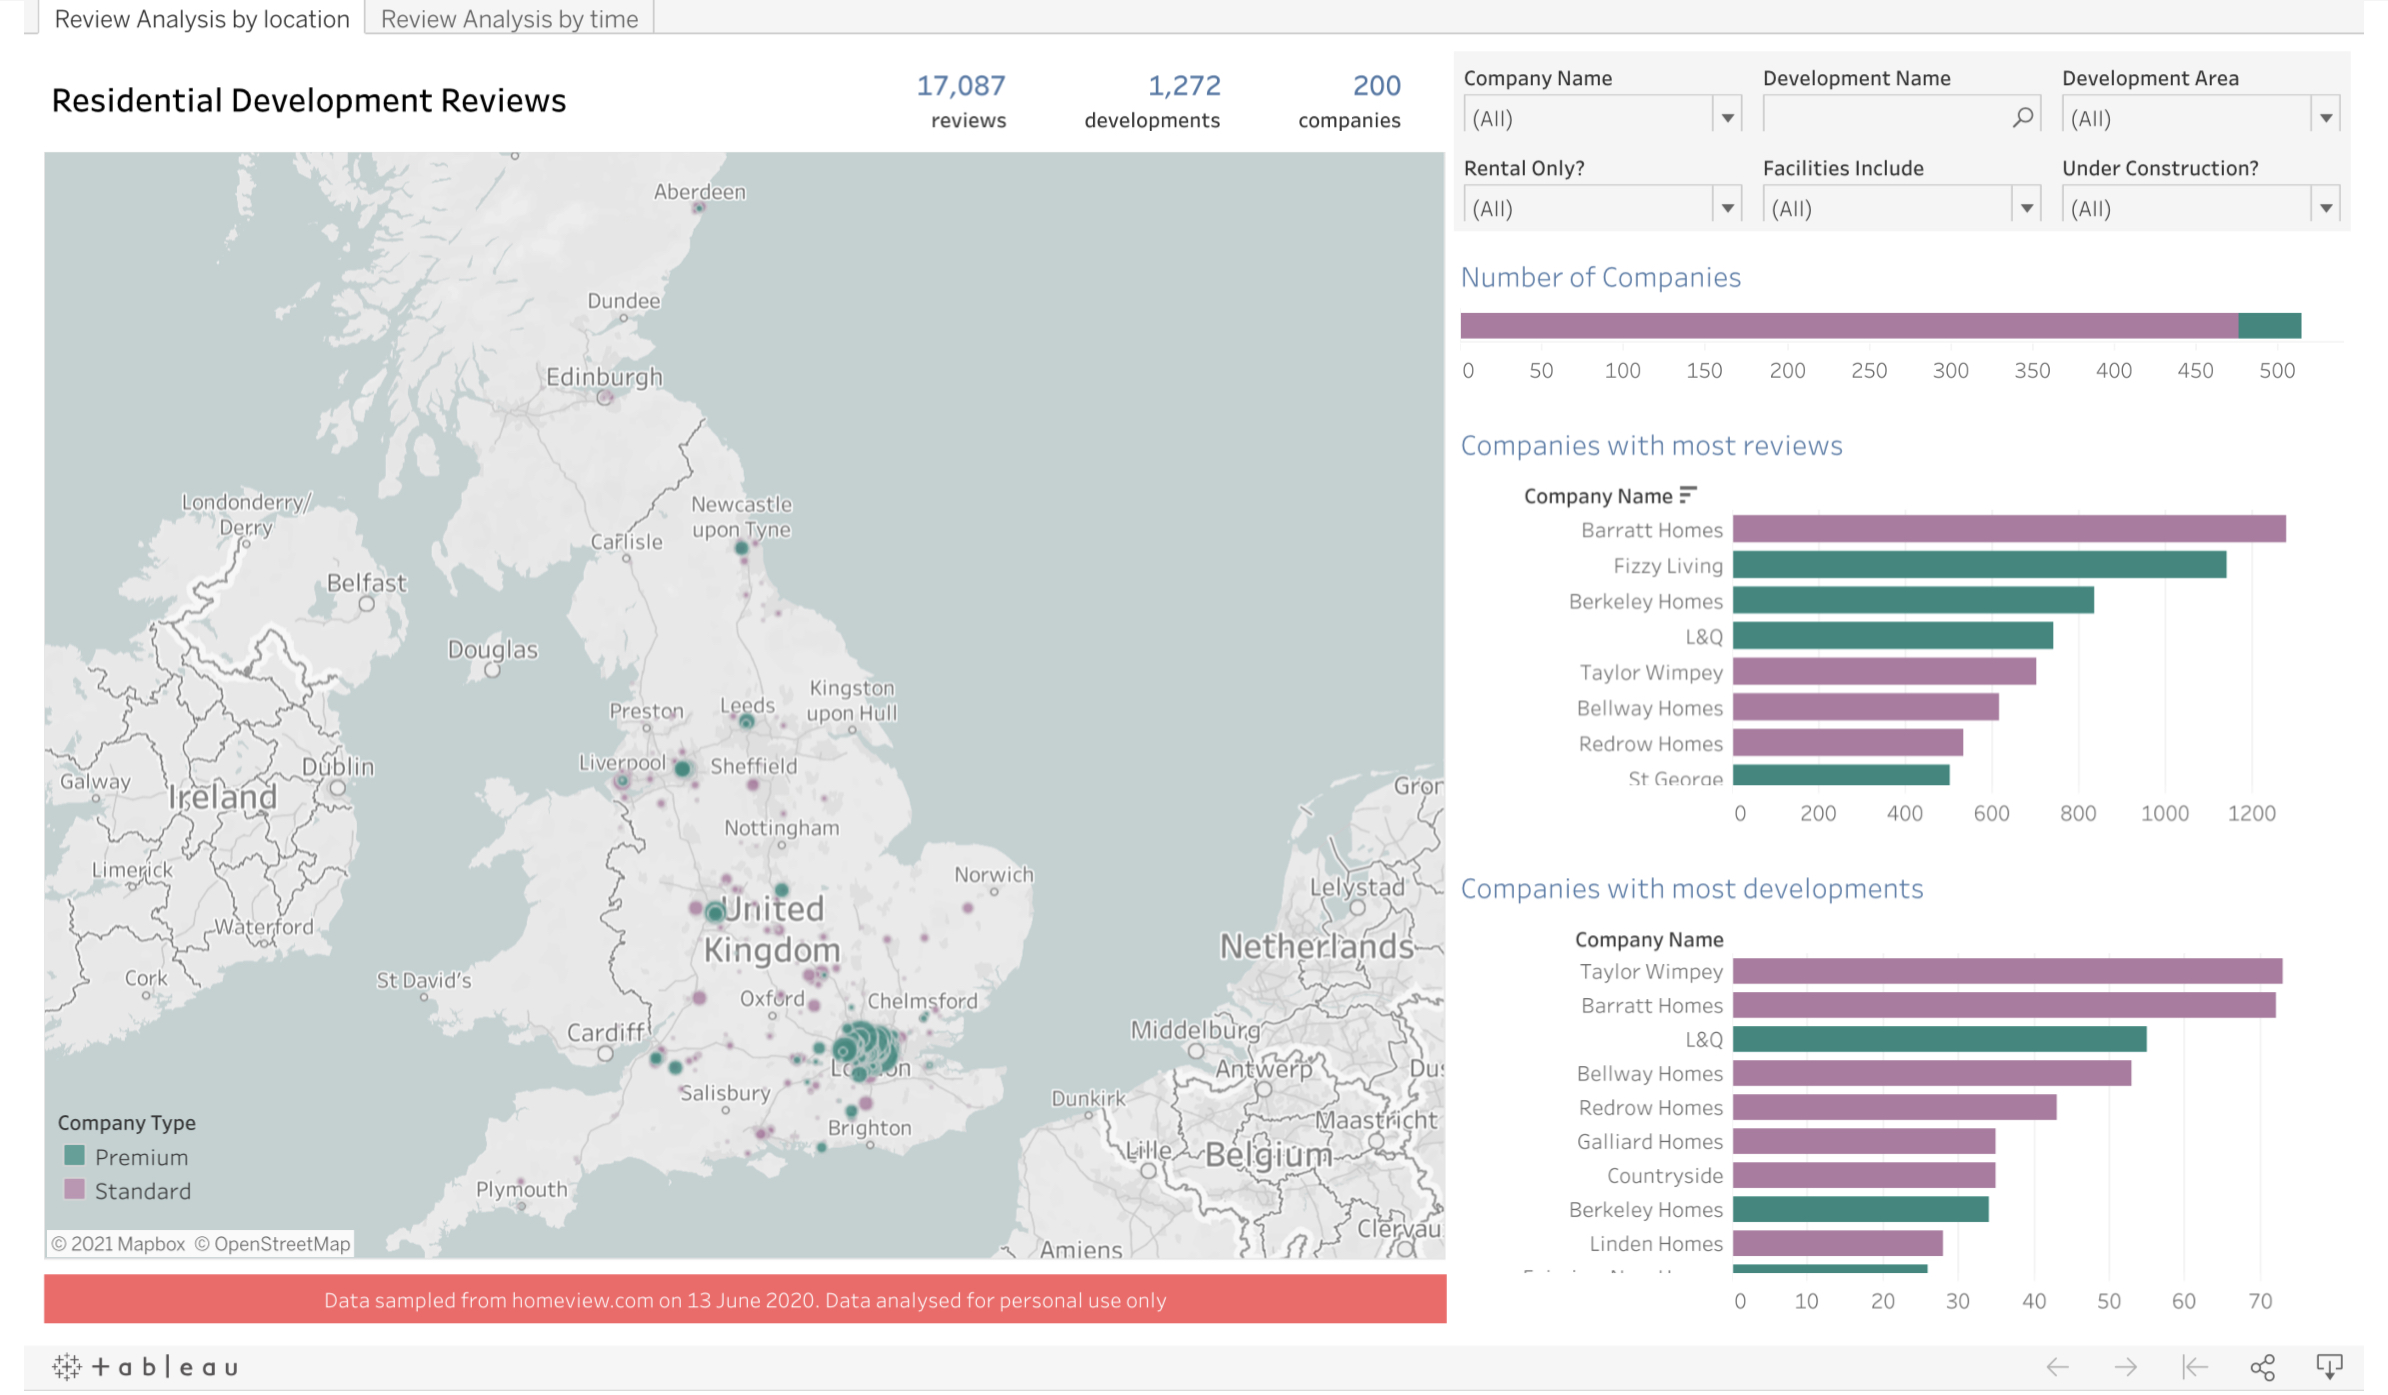
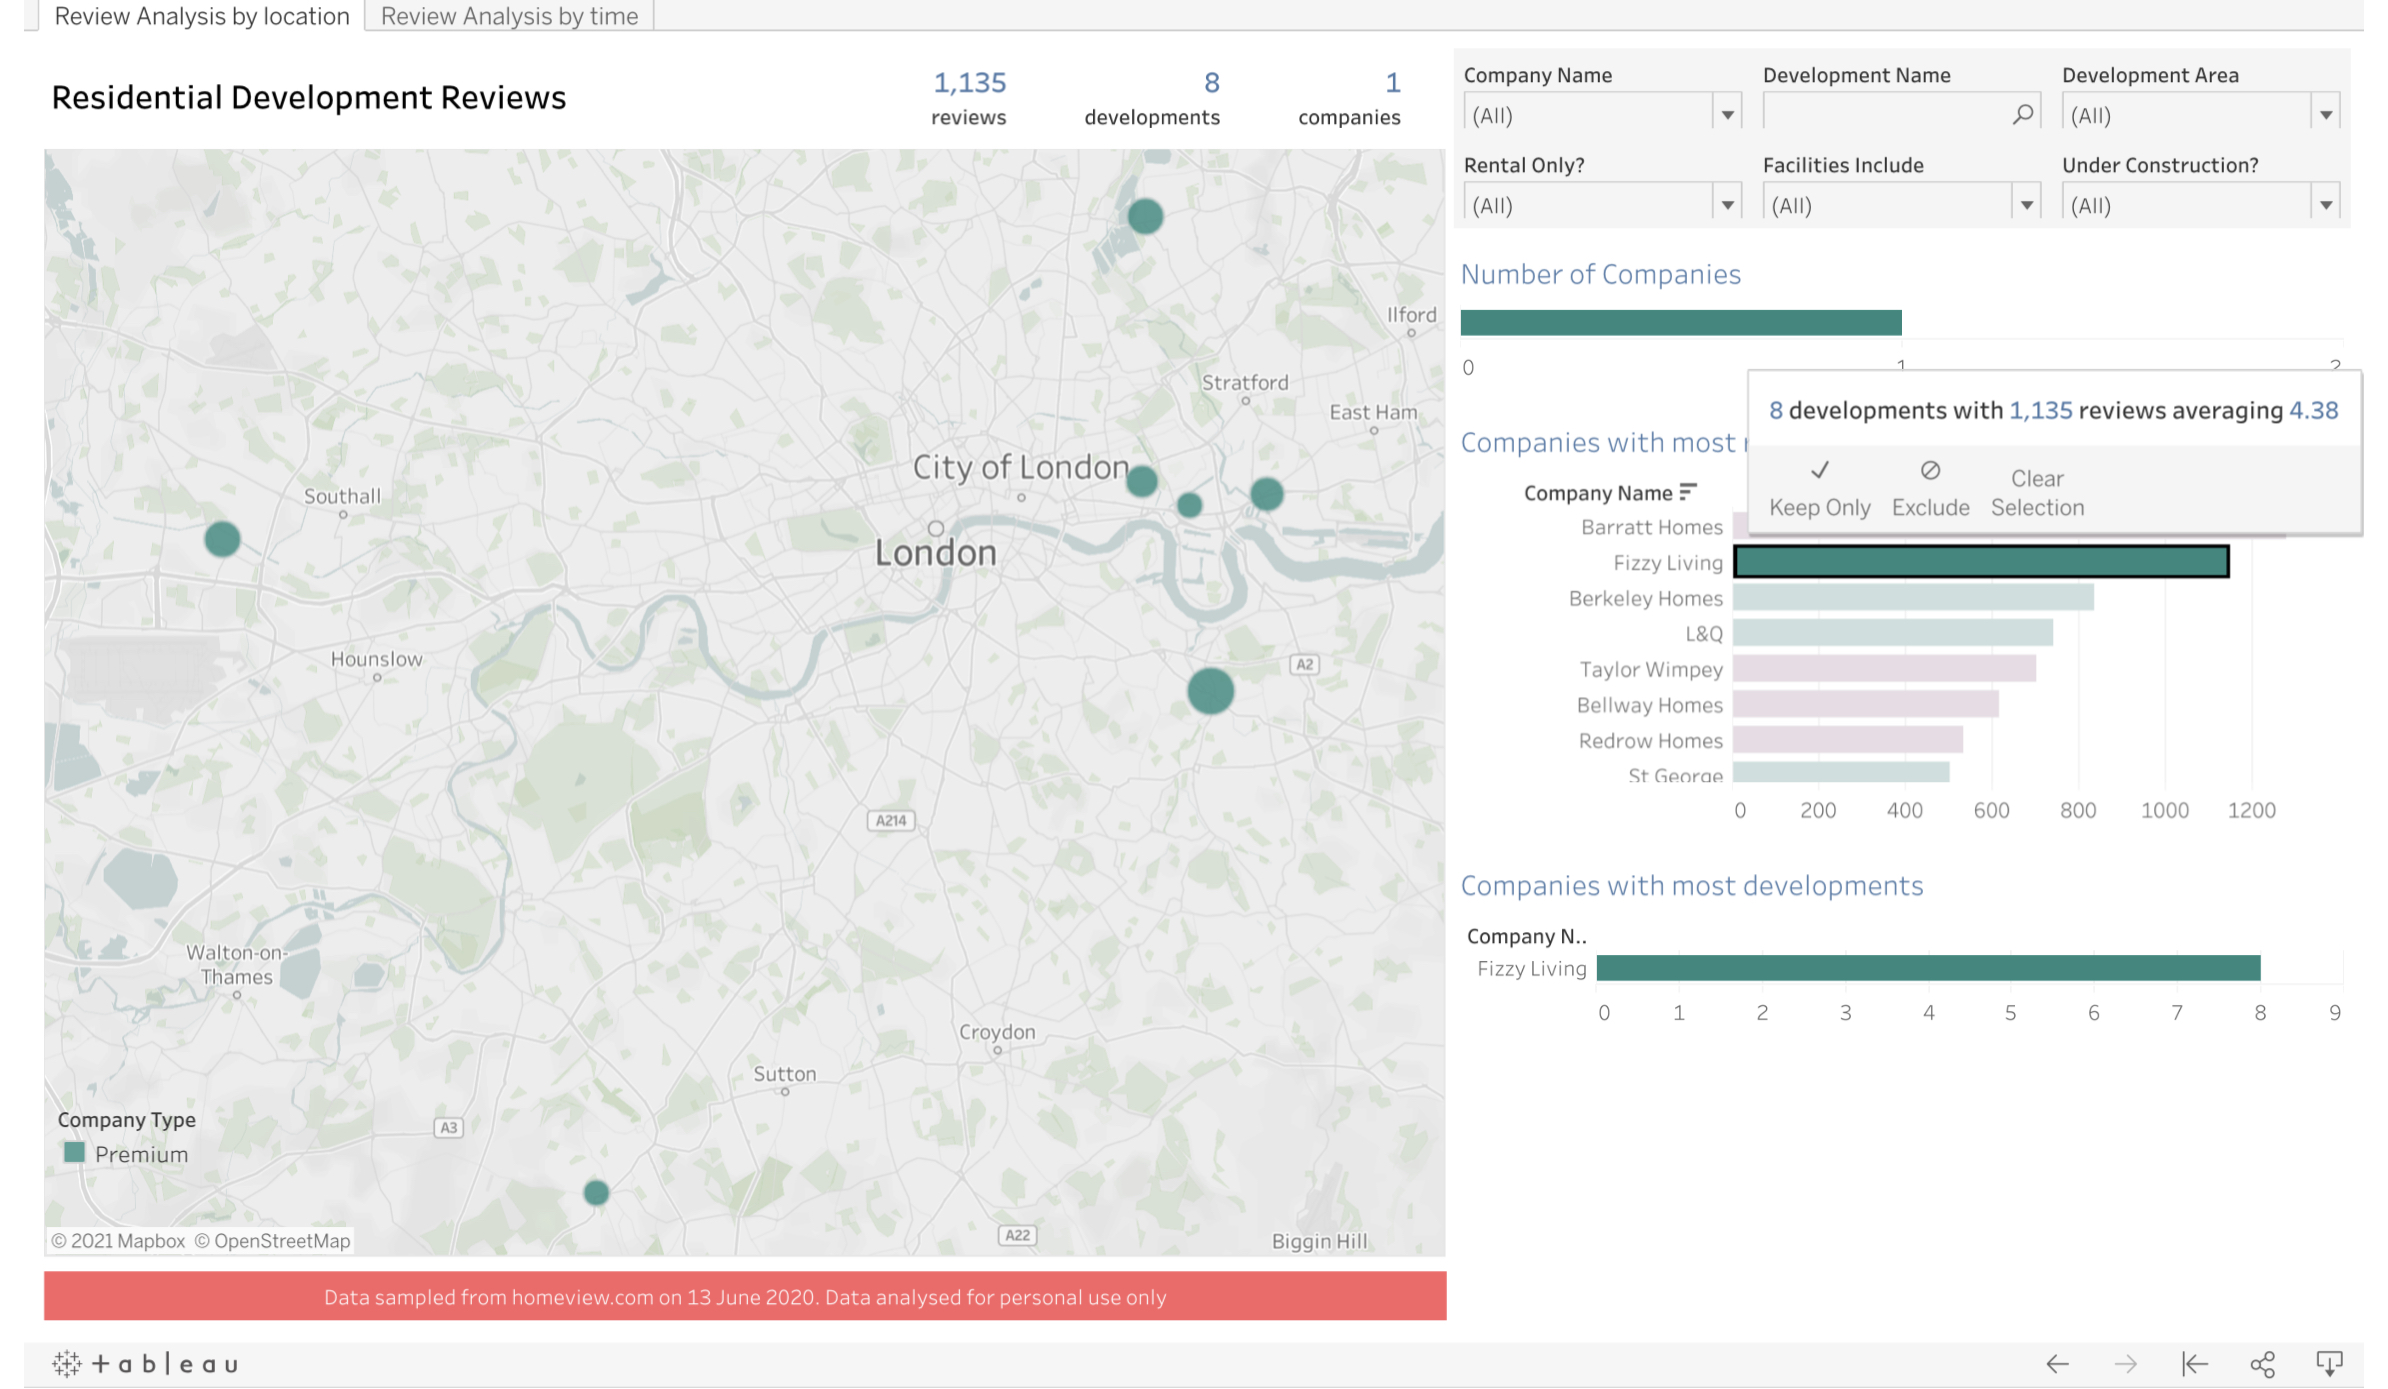
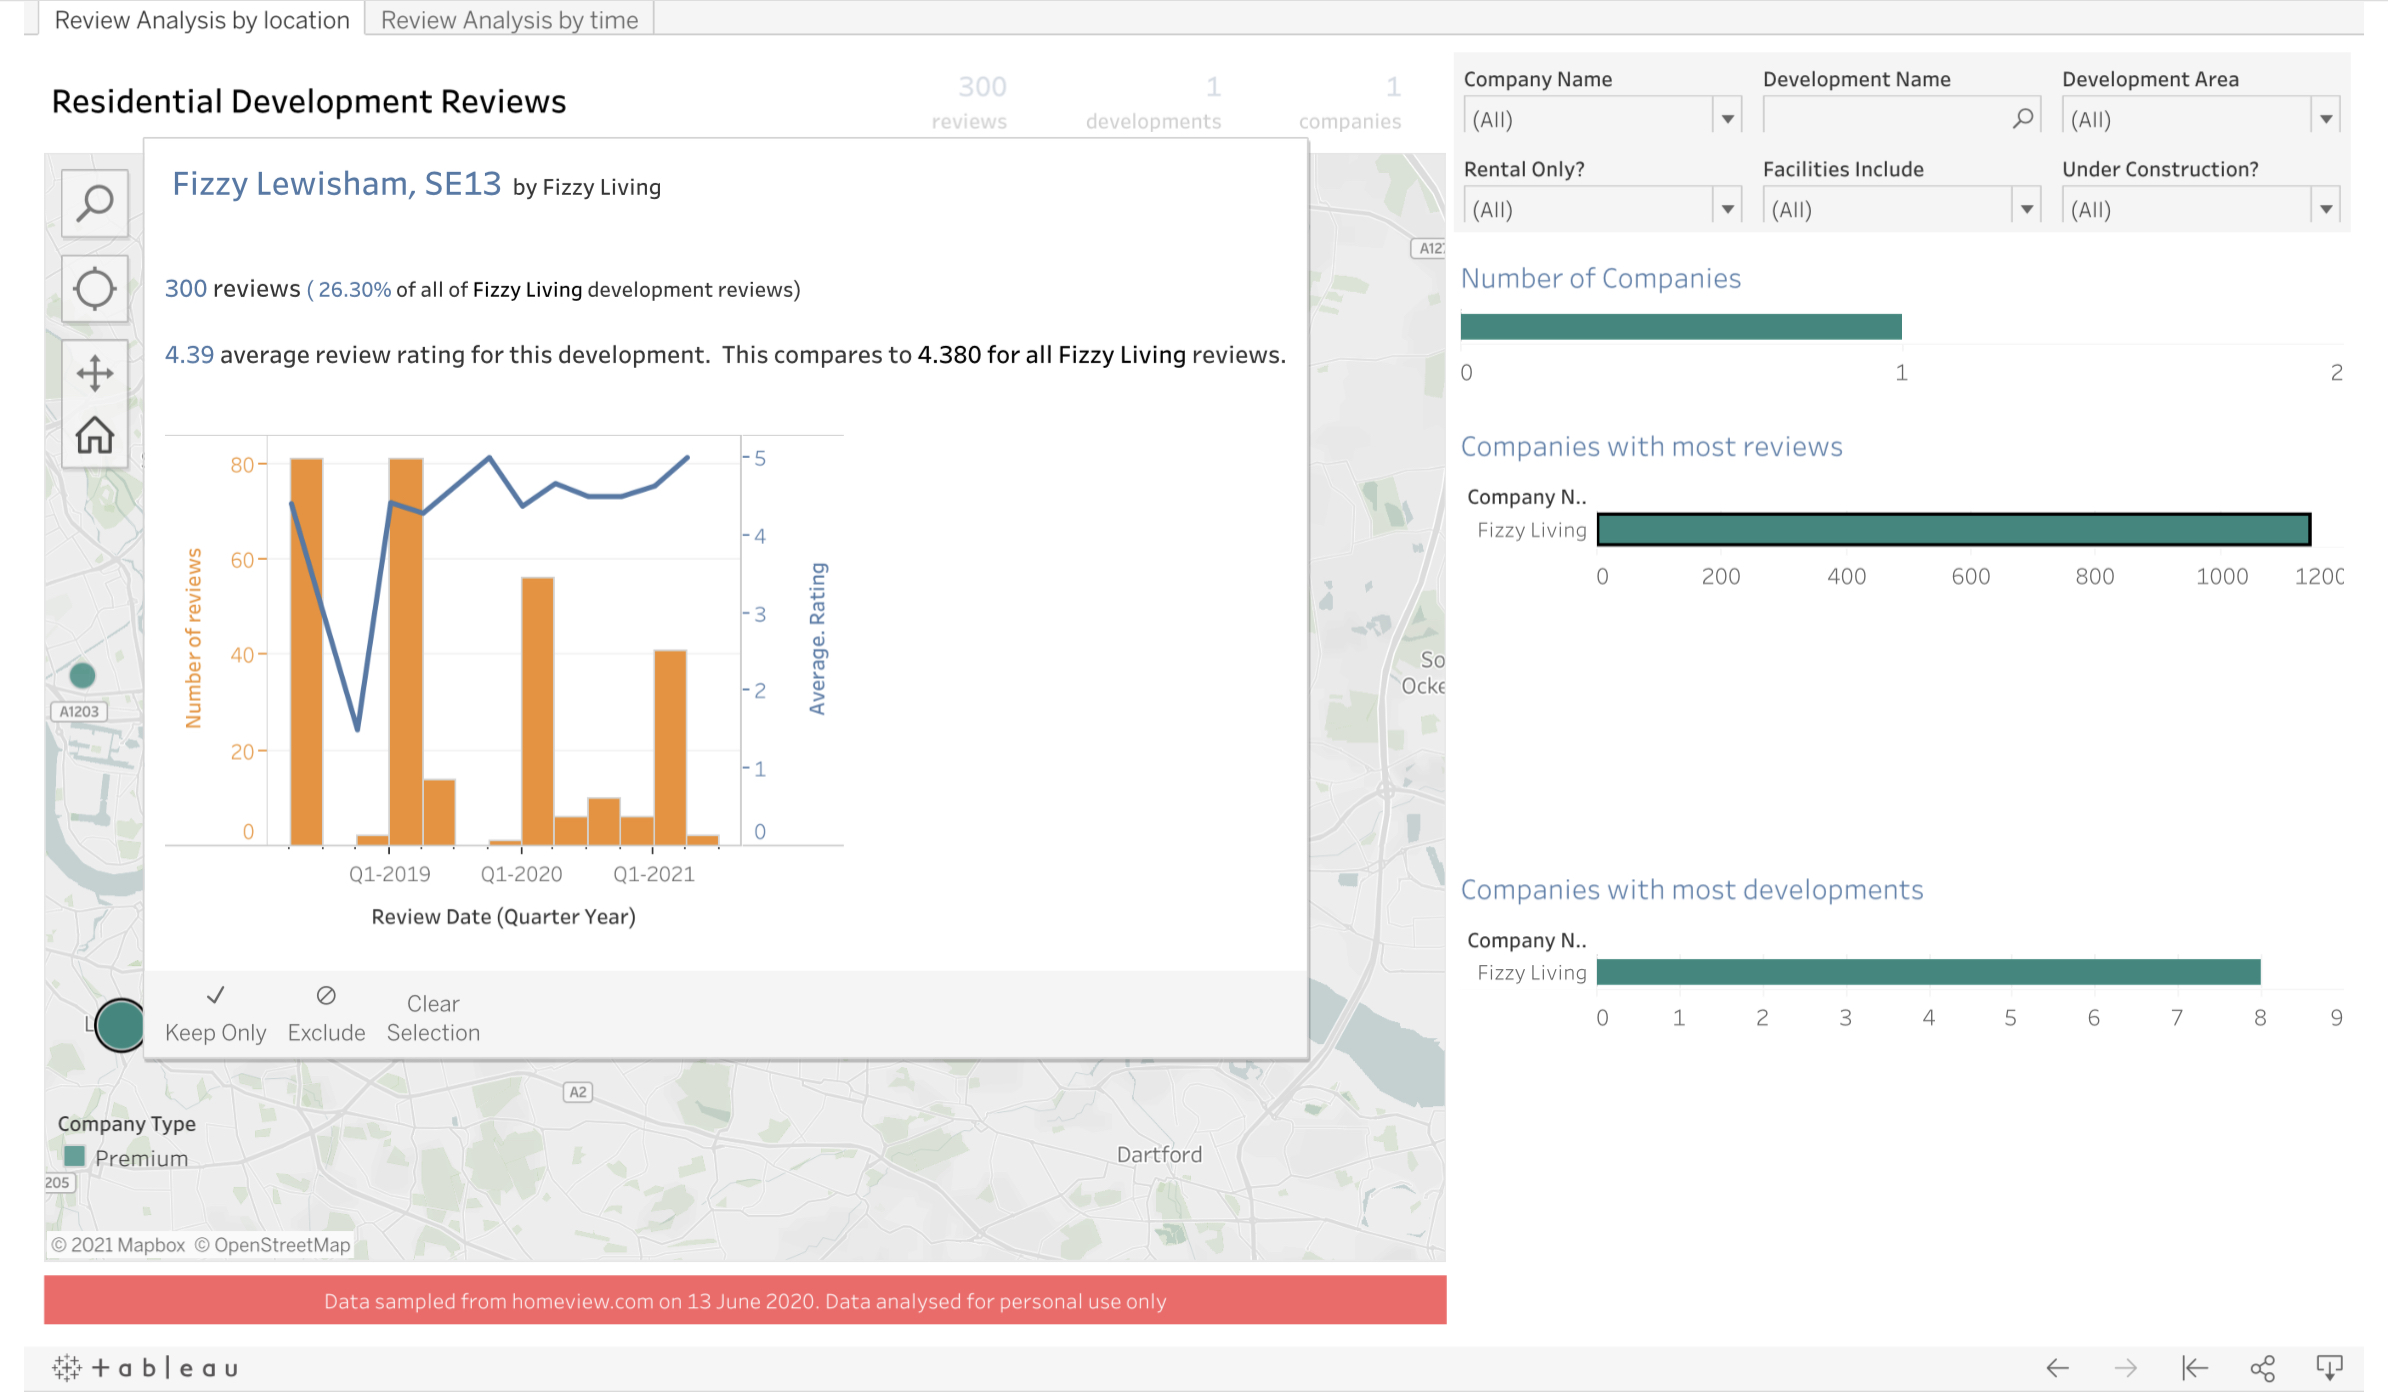
- A map based view which plots each development on the map, with charts summarising the number of developments and number of reviews by each developer. Additional filters enable the user to explore the data by company, location area, development name, build to rent developments only, build status of the development and facilities. Hovering over any development shows additional information about the reviews for that development – including when reviews were left and how the average rating changes over time. You can also see which developers have signed up for premium product features, and which are using the standard (presumed free) model.
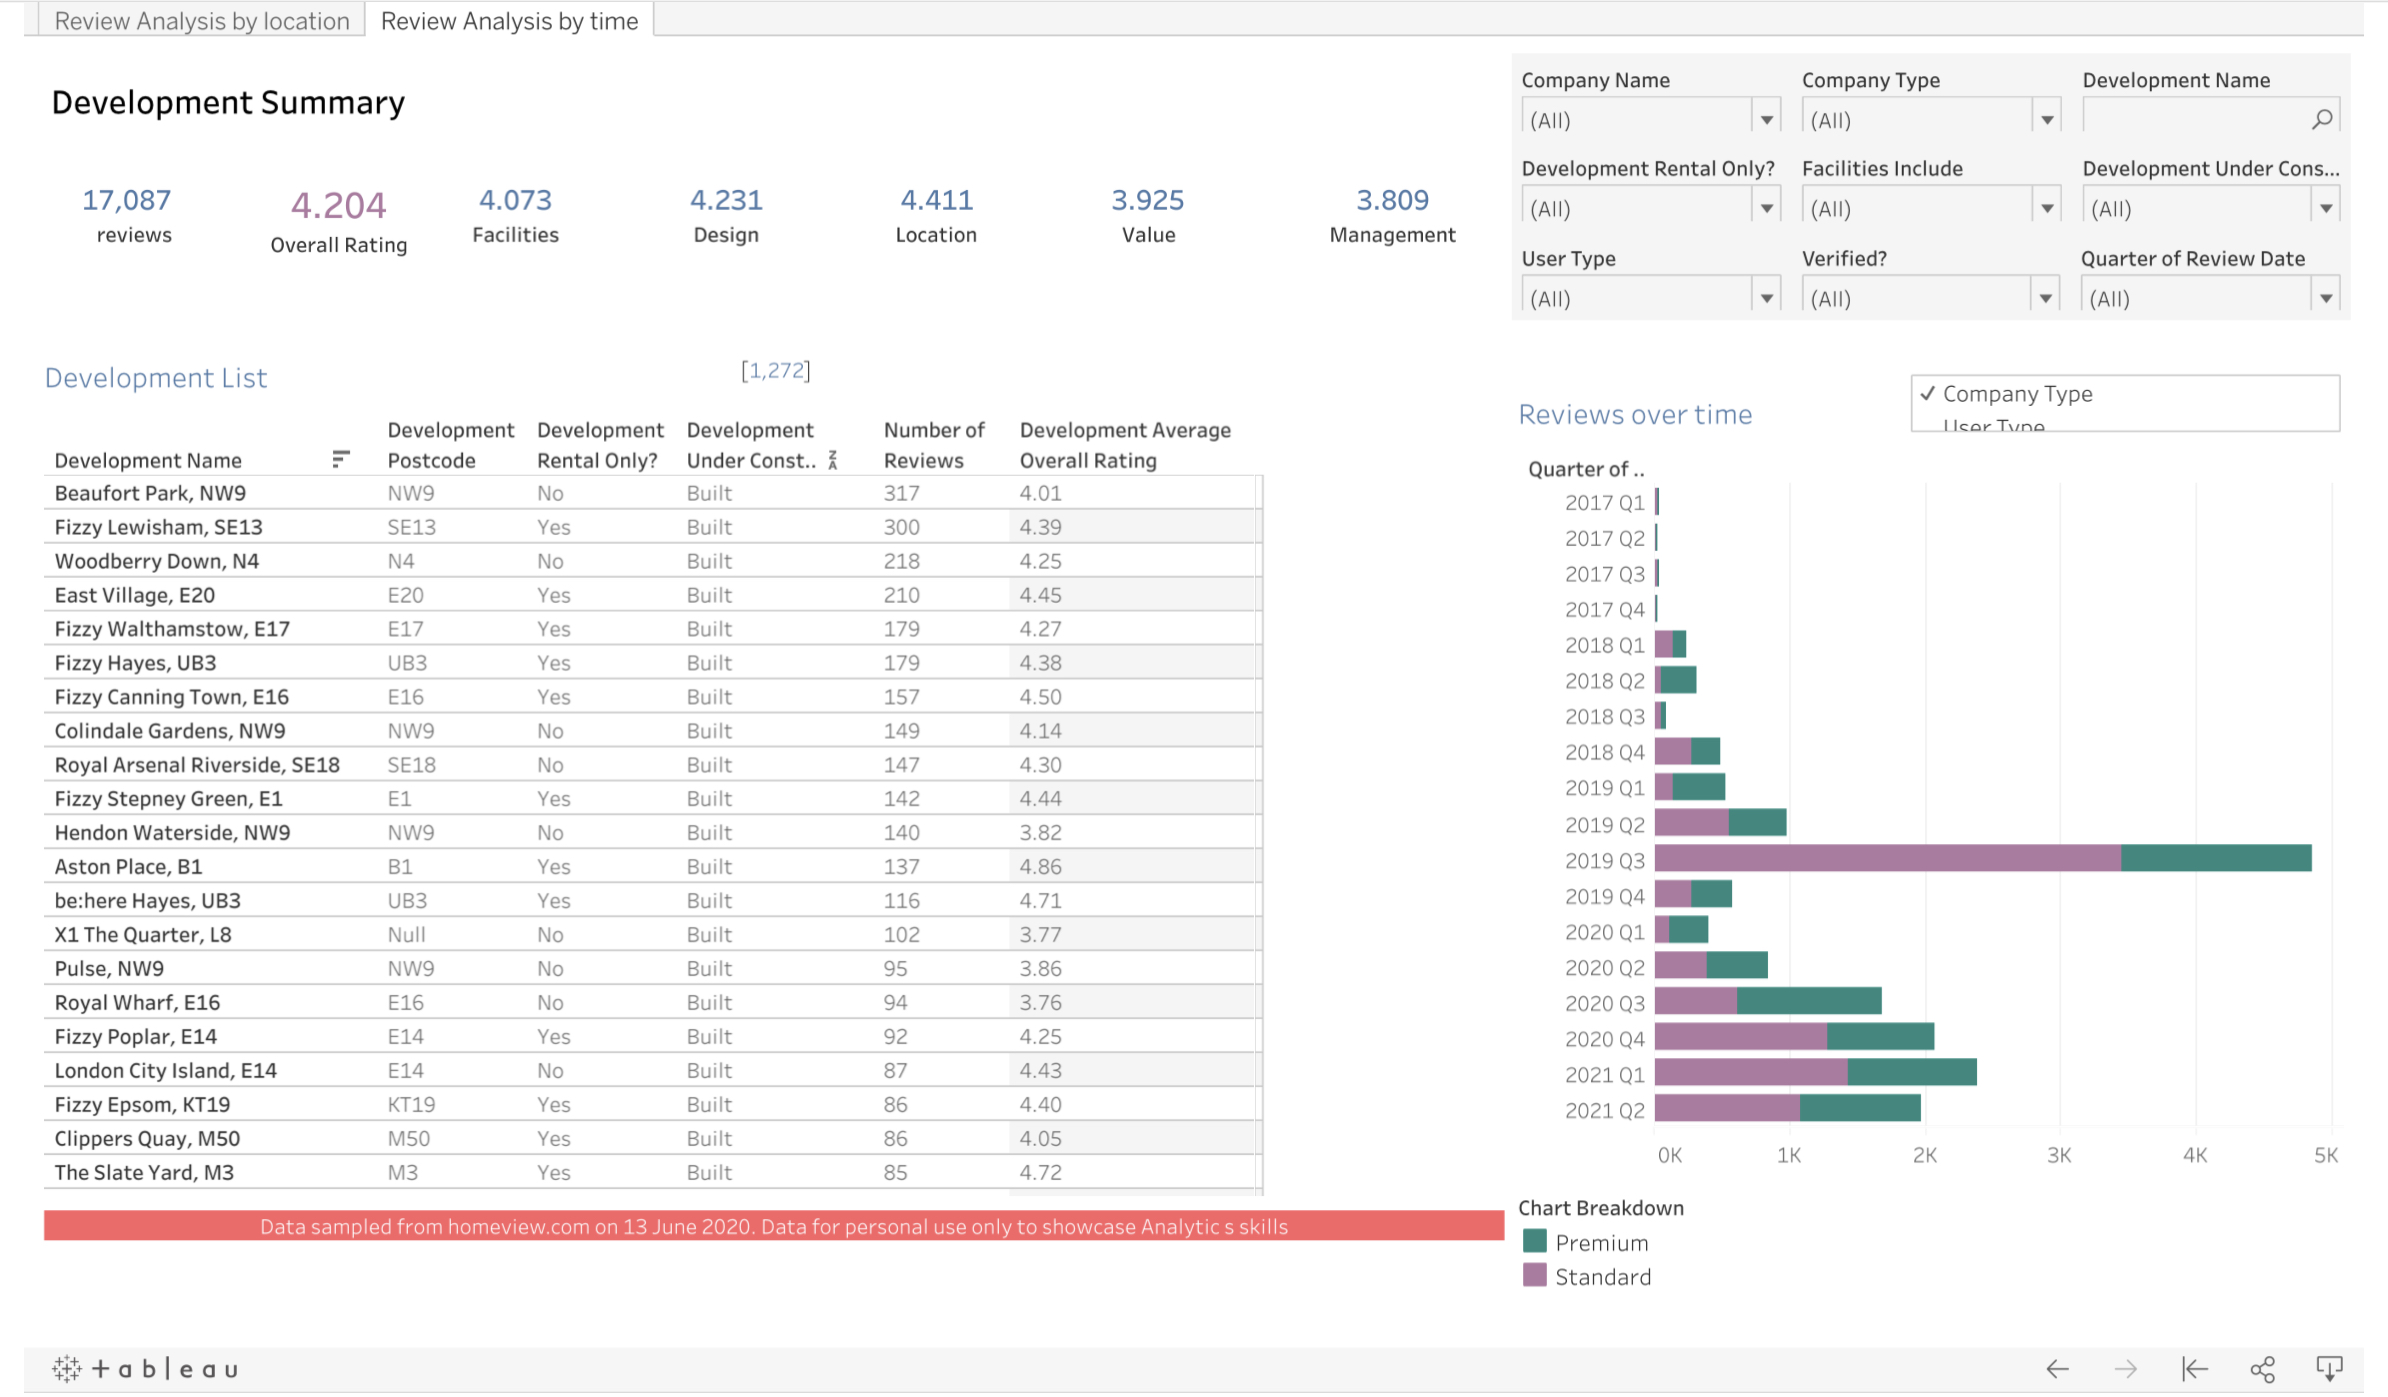
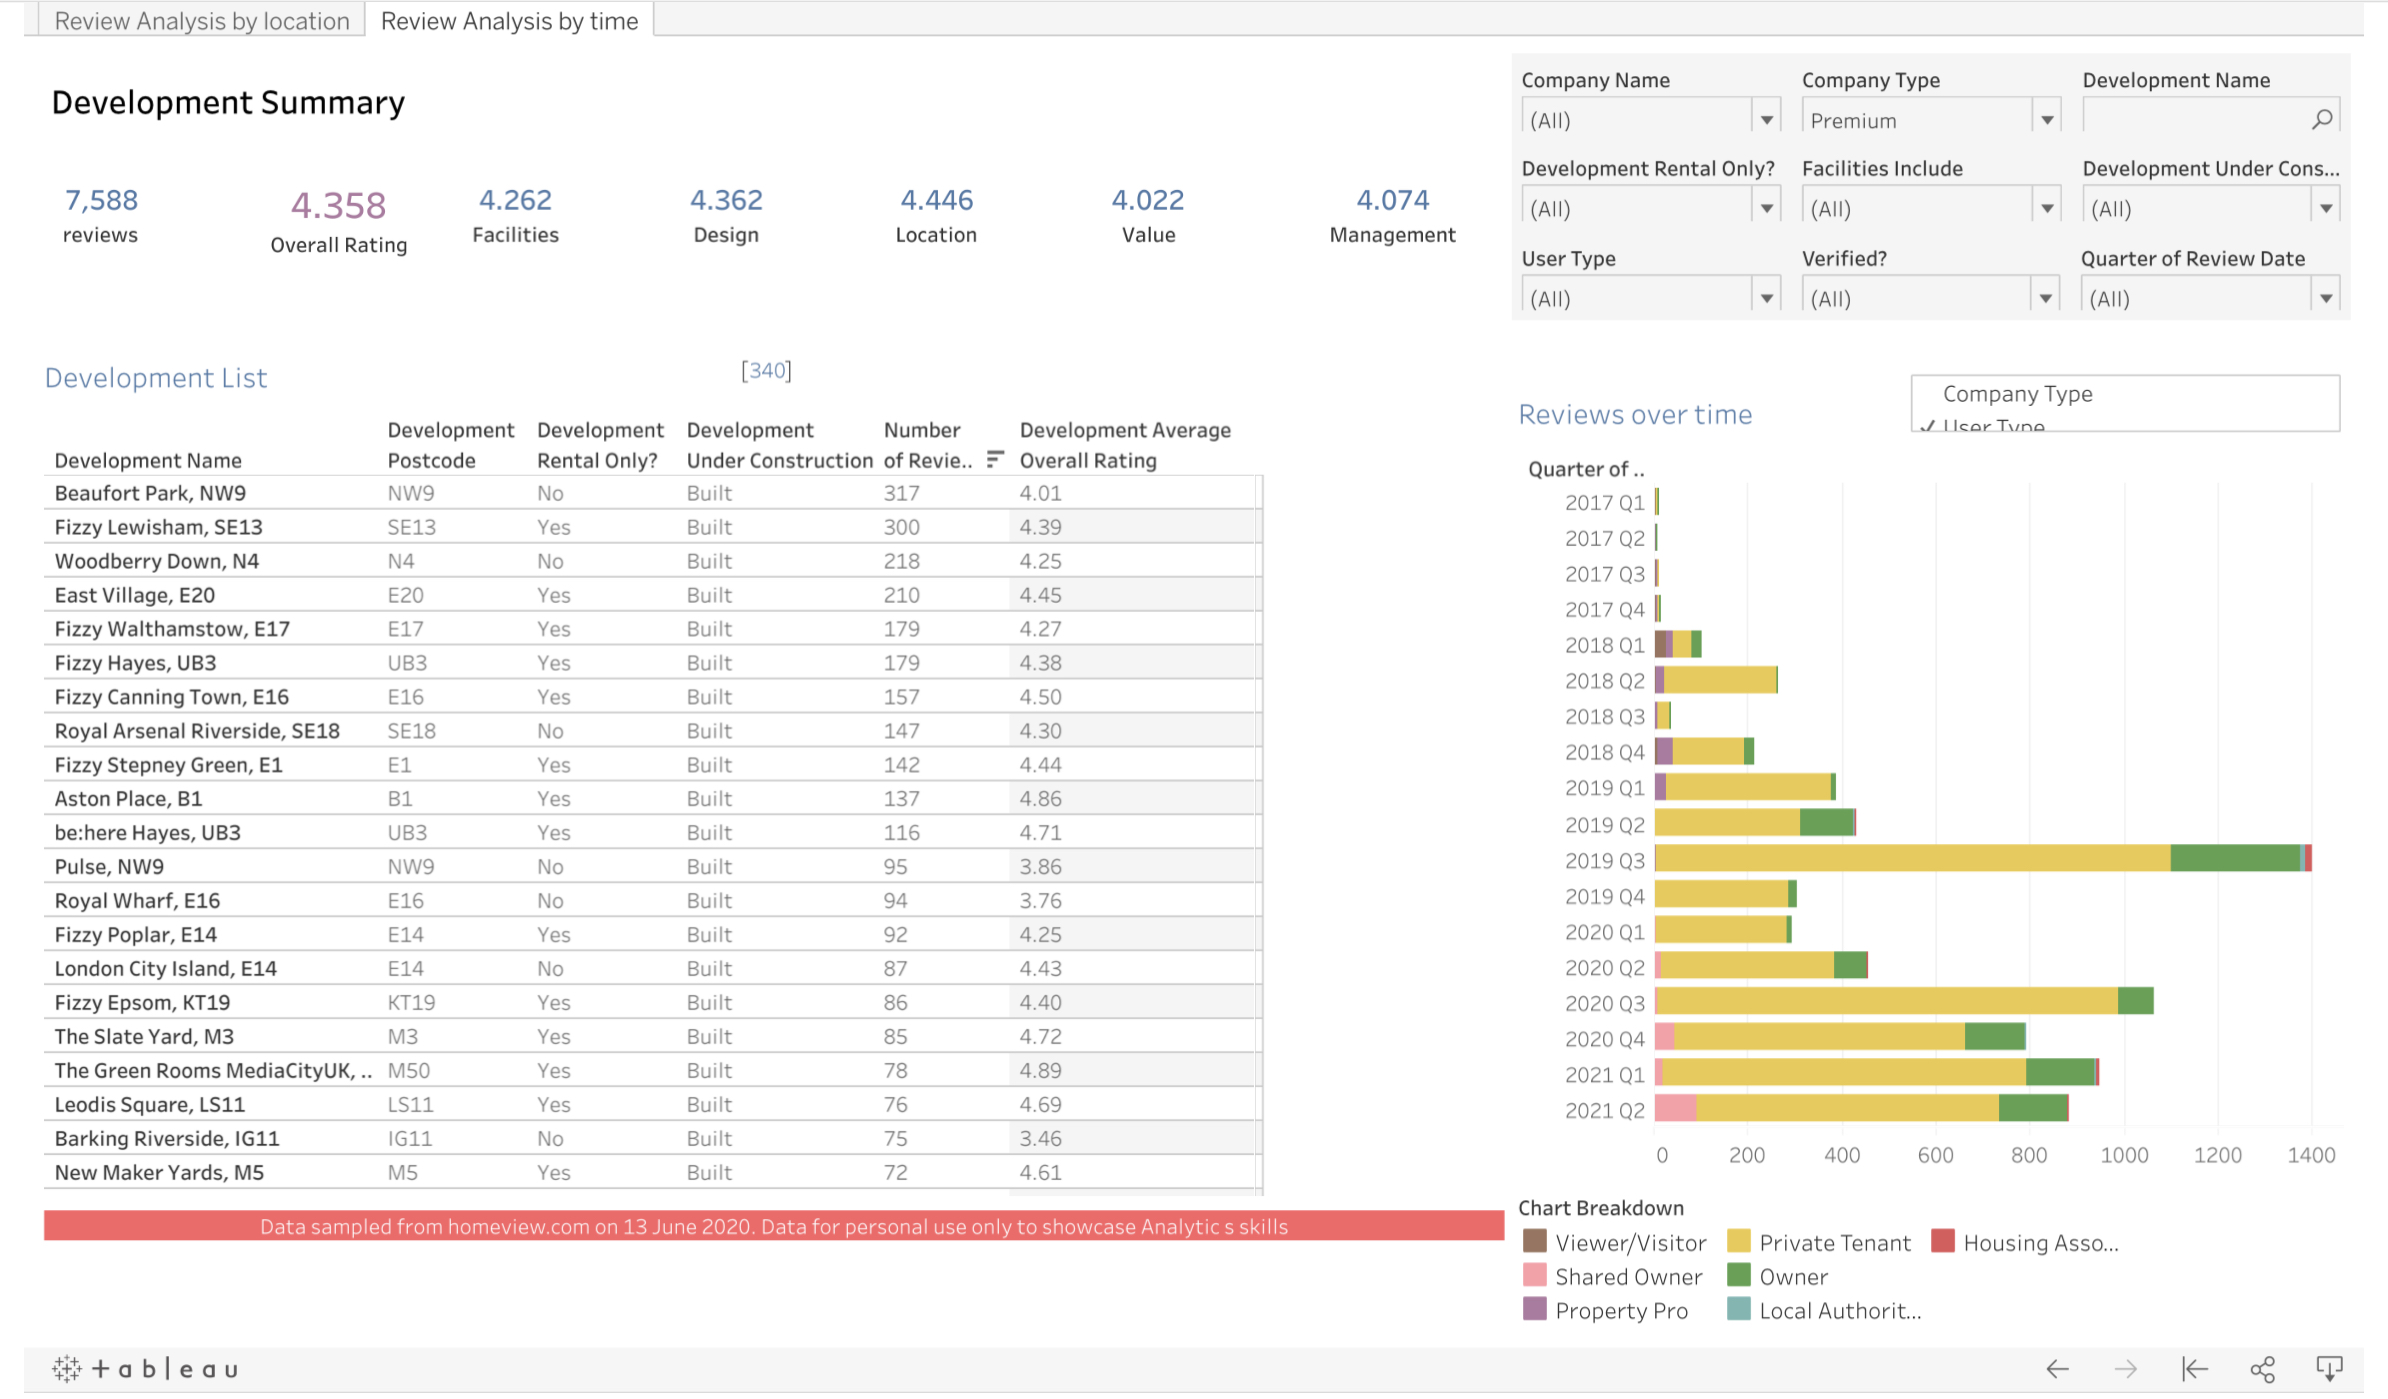
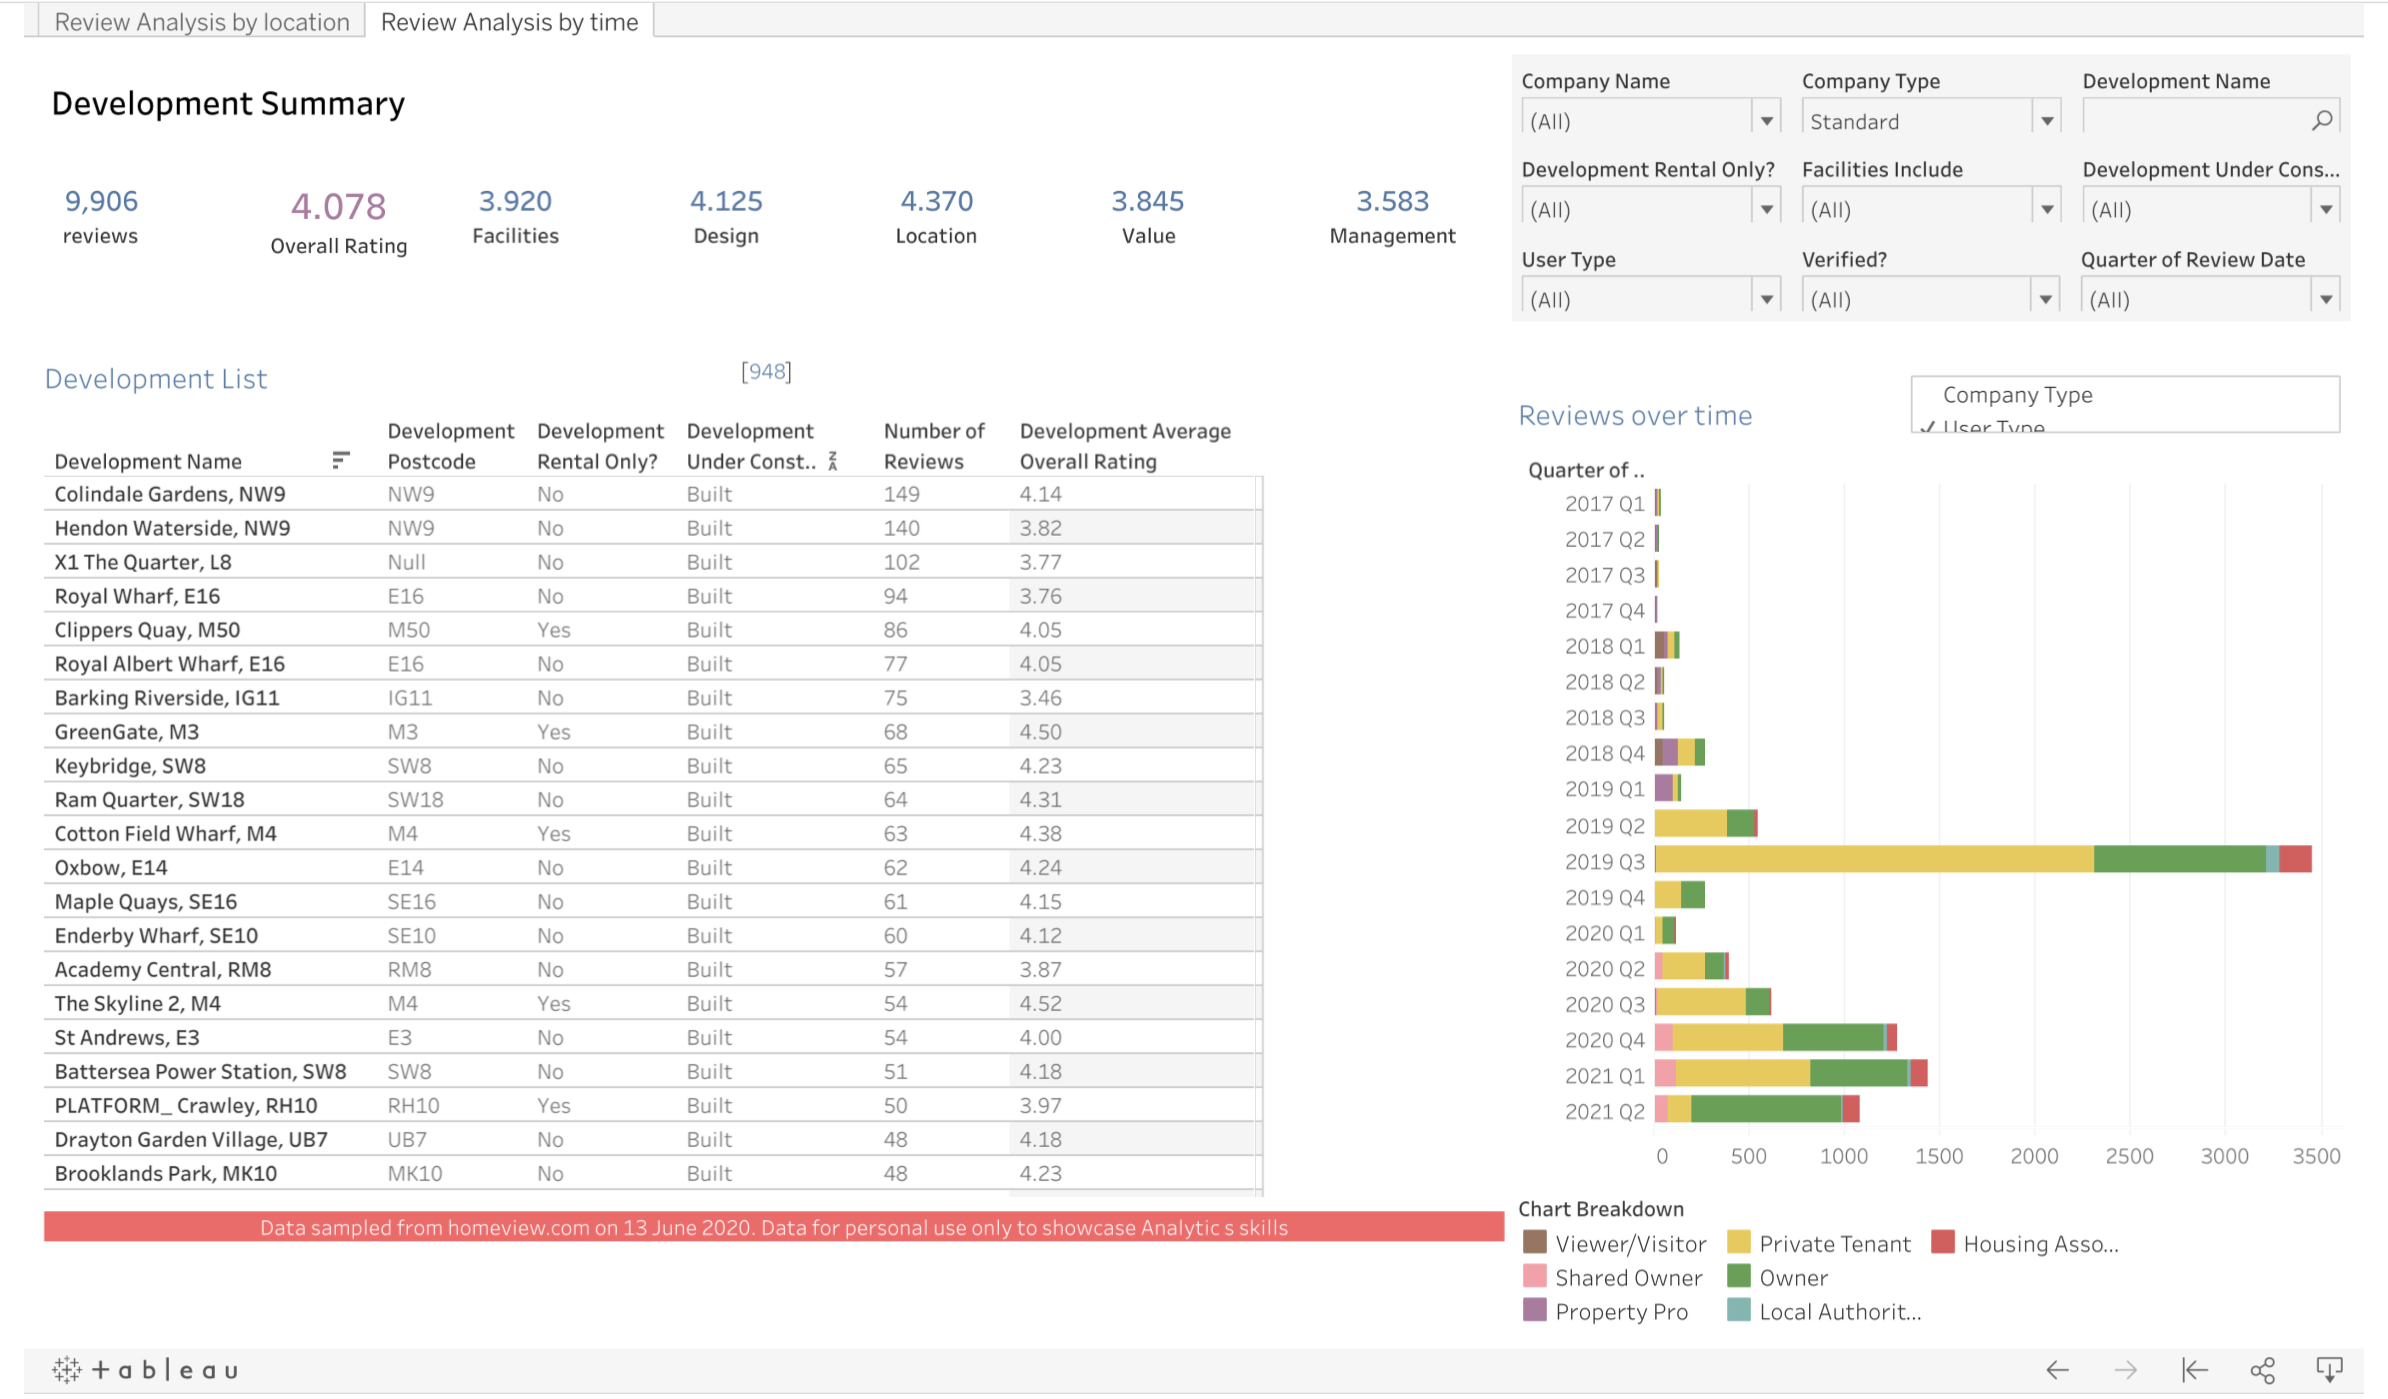
- A tabular view of the data showing a summary of all developments in a sortable table. This view allows you to select one or more developments and to view a breakdown of the reviews by different review categories. On this dashboard you can see a chart breaking down when reviews were left over time, grouped by either the type of person leaving the review, or the type of developer the review is left for (premium features vs standard/basic type). All of the additional filters that were on the map based dashboard are available, plus the ability to filter by user type (e.g. owner, tenant, visitor), whether the user reviewing is a verified user, and the date period of the review.
All of these insights can be gained from publicly available data on the website. Both dashboards are optimised to work on tablet and mobile devices (just to show how easy this is to achieve). To explore the rich insights that can be gained from visualising this data please view the review dashboard.
Data insights and lessons learnt
Data was captured on 13 June, with all insights relative to date on or before that date. Below you’ll find some key things I discovered whilst reviewing the data.
Key stats:
- HomeViews website lists 514 developers – with 38 marked as Premium and getting additional product features (assumed at a cost). Of the 514 developers listed, 200 had one or more developments with one or more reviews.
- 289 of the developers have one or more development linked from their developer page – indicating 56% of developers on the Site’s development directory have reviews they should be aware of.
- There are 1,272 developments with one or more review on the site – link to one or more of the 289 developers.
- In total there are an impressive 17,087 reviews on the site since it launched in 2017.
- The first review was in January 2017 – making the site 4.5 years old. In the first year there were a total of 112 reviews, rising to 1,094 reviews across 2018. There was clearly a drive to capture reviews in Q3 2019, with 28% of reviews (4,701 reviews) left during that quarter.
- The 38 Premium category Developers using the product have 44% of reviews all reviews.
Product insights and key learnings:
- The HomeViews product has collected an impressive volume of reviews in a short period of time. Initial analysis suggests some bias in the way review data is collected by the product team and their B2B customers. Trust Pilot and other independent review platforms show B2C users complaining they haven’t received their gift voucher incentive. Such bias would be reduced as a percentage of all reviews as the product scales and the brand becomes a household name with more organic user generated content rather than what often appears based on review dates to be targeted and periodic review marketing.
- These dashboards provide a great way for product teams (or competitors) to explore the data and learn more about the product.
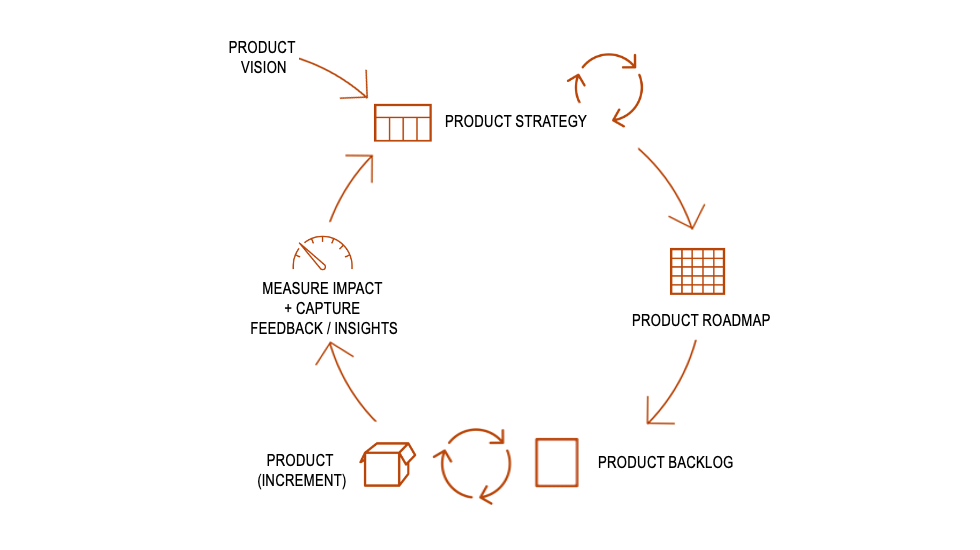
- As a product manager they help to measure success and understand the product adoption, customer segments, product features, and bottle necks.
- Products sales, marketing and client account teams can utilise the self-service views of the data, particularly the map view and filtering by company, to enrich B2B client conversations, drive feature adoption, and target potential Premium clients.
- Developers can use the self-service dashboards to identify new features and their specifications, or to consider edge cases for testing features and defects.
- Through exploring the data it is easy to identify new product features, or even brand new data analytics products, that could be monetised and sold to existing and prospective B2B clients – e.g. to gain insights into their reviews and opportunities to address them. They also provide product growth opportunities to new user segments such as Block Management companies and Right To Manage companies and Residents Management Companies.
- The concept of the product is solid – but it may struggle to compete with comparable products such as Google Reviews and Tripadvisor based on user generated content alone due to the cadence of people moving versus using local businesses, travel, tourism and hospitality companies. To give a true indication of what it is like to rent or own in a development other experiential and service measures should be collected and provided to users.
- The average rating for developments of Developers who subscribe to the site’s premium version is 4.36, whilst standard developments are 4.08. Even removing reviews by users of Housing Association, Shared Owner or Local Authority the standard developments average rating is 4.09 versus 4.37 for premium companies’ developments. Further analysis is required to understand if these ratings are caused by bias in the way the data is collected, the types and age of properties being reviewed, or the way the site presents the developments of Premium companies.
- Whilst the site has a detailed reviewer verification process, I was able to find a number of duplicate reviews and ways to game the review verification process. To be trusted by its readers, these process shortfalls should be tracked by the product team with a view to remediating them over time.
- Exploring individual reviews reveals some sensitive information about the health and safety and security of individual developments. Some reviews talk about feeling unsafe, break-ins, intruders, drug addicts and people sleeping rough in the developments. Whilst this may be useful information for those considering moving to the development, it also creates targeting opportunities for those with a motivation. Unfortunately the site makes this information easily available for those with the time to search for it, and it could result in people losing confidence in the product.
Whilst these dashboards are powered by a one time data extract (albeit one that can be re-run and data refreshed automatically) it would be easy for product teams to develop dashboards like this and hook them up to their own real-time database to create on demand, self-service product data insights. Automating the collection, analysis and visualisation of this data took me 14 hours over a weekend. This is a small investment for the value that can be unlocked from the insights.
Other data insights that could be investigated
Having identified high level patterns in the data, I’m curious to explore a number of hypothesis I have about the potential and suitability of such review products for real estate:
| Hypothesis | How would I test this? |
| Publicly visible residential development reviews pose a safety risk to residents | I’m keen to understand the risk associated with public review data and the legal and ethical responsibility data collectors have to protect those in blocks that they are distributing data for. To test this hypothesis I plan to parse the individual review texts through a custom Alteryx script I’ll write to count the number of instances of each word and identify common themes in the reviews. I’m interested in exploring themes such as “people often talk about…” for a development or developer. With a little extra work I should be able to identify the sentiment related to these key themes. For example if people often talk about security – is this good or bad security? |
| Residential development reviews may negatively impact property values and reviewers may not consider this when sharing | I’m curious to segment the data by type of reviewer and analyse those of owners versus other types of reviewer to understand differences in ratings and sentiment of review. Using these segments we should be able to understand any biases in the data based on who left the review. Over time it would also be possible to look at changes in property prices over time – however for this dataset the time period is likely too short and too small to be statistically significant. |
| Development reviews contain biases and therefore cannot be used or trusted as the sole measure for the quality of a development | This hypothesis requires further consideration on whether it could be investigated based on public data alone. There is evidence online that some reviewers were incentivised to leave a review in return for a reward, whilst the frequency of some development reviews suggest one-time drives to collect data – which have the potential to be targeted at those residents who are likely to leave a positive review. |


0 Comments