In Product Management we often want to understand the size and opportunity presented by solving different problems. We can then use this insight to help prioritise which problems we want to focus on and reduce the risk of focusing on the less important problems to solve.
A great technique to achieve this is to break a problem down into a set of hypotheses and experiments we can test and analyse. In this post I share one such problem space I wanted to learn more about Flexible Office space providers to support my continued learning about the real estate industry and identify where public data could be used to add value. This exercise gave me an opportunity to practice my data analytics skills and to self-learn Alteryx with a practical application I could apply the tool to. This project took a weekend to complete and below you’ll find links to the dashboard I created and what I learnt as a result.
Problem to investigate
With companies increasingly moving towards hybrid working patterns and trying to reduce their reliance on expensive long-term traditional office rentals I was curious to understand more about Flexible Office space providers (eg WeWork, TOG, Regus) and their customers.
In particular, I set myself the challenge to deepen my understanding of:
- Where are Flex Office providers located geographically?
- What facilities do providers offer and do any facilities differentiate them from their competition?
- Can you reliably identify which companies are using Flex office spaces as their main office locations? If so are there any patterns such as tenure or occupant industry type?
Approach to understand the problem space
I took a 3 step approach to investigating these questions:
- Identify and source public data to analyse
- I sourced Flex Office space provider info from their website. You can manually capture it, scrape it or find an API on their site. I scraped the webpages using Alteryx to save myself time and reduce manual errors
- I sourced company info (names and addresses) from the U.K. Government Companies House website. This can be downloaded in CSV format or you can request a developer account to access it programatically. I used a CSV extract to save time
- Blend the data together
- I wrote a script in Alteryx to standardise the data and improve data quality. The script then extracts a list of companies who’s address postcode match with a Flex Space provider’s location postcode
- Analyse the data and look for patterns
- I used Alteryx to profile the data and identify areas to cleanse it to improve matching and subsequent analysis
- I then plotted the data in a Tableau dashboard to discover insights within it
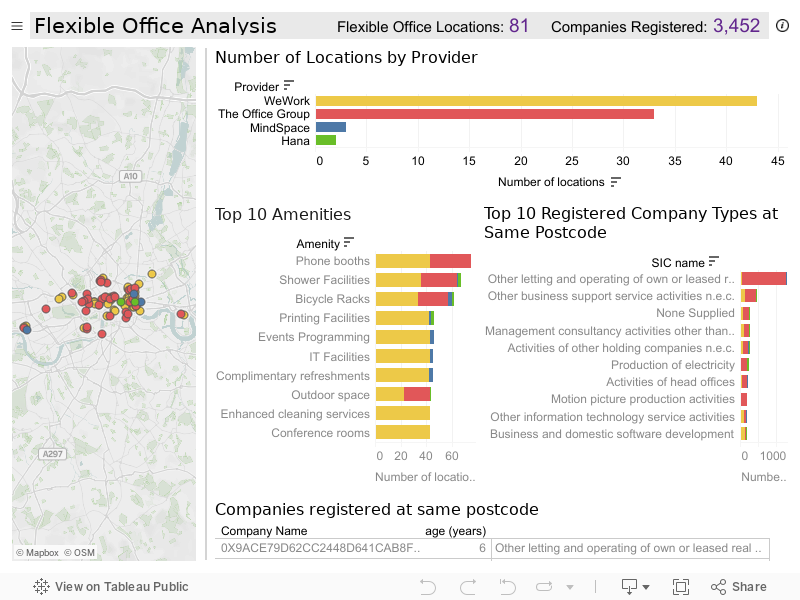
Proof of concept dashboard created
For a proof of concept I simplified the problem to focus on London and chose 4 of the larger flex space providers for comparison.
The resulting dashboard can be seen in my Tableau Public Gallery and is embedded below.
Limitations of this approach
This approach isn’t perfect, but it served its purpose for a quick and scrappy experiment. For completeness, here are some of the limitations I identified with this approach:
- It won’t identify larger companies with registered headquarters at traditional office lets – for example, a Bank may use Flex office space in addition to traditional office leases.
- It is unlikely to identify freelance and independent companies.
- Some companies may use alternate postcodes for the same building.
- A company that is headquartered in a flexible office space may use multiple locations and providers. This approach will only capture the primary location where the company is registered.
What I learnt from this approach
- The approach rendered some valuable insights for this statistically significant data set. It is easy to see where providers cluster and which areas may be underserved (keeping in mind I only sampled a small set of providers).
- Some locations had an unexpectedly high number of companies registered – take for example The Office Group’s The Shard location. Further research shows The Office Group provide a Virtual Office product option to allow companies to register their business at one of the company location addresses. They market this as “Raise your profile in the cities where you want to be noticed. Choose from over 40 premium business addresses.” https://www.theofficegroup.com/uk/workspaces/virtual-office
- A lack of standardisation in facilities/amenities makes them difficult to compare across locations – sometimes even with the same provider. There’s an opportunity for a third party tool to map and normalise the amenities list and make them easier to compare and filter available Flex Spaces on.
- The Companies House industry classification codes are too granular and would benefit from aggregating to a summarised level with drill-down options in order to better understand where different types of companies are headquartered in Flex Spaces.
Value identified from my analysis
Using this approach it would be possible to generate a targeting pipeline for companies that may be in the market for flexible office spaces and/or additional office and productivity services.
The data is also useful for Tenant Advisory brokers to help occupiers find suitable office space, and for Landlord Advisory brokers to understand the Flex Space market.
Future opportunities to further this analysis
- Improve data quality
- Improve data blending accuracy – e.g. where a building/space may have multiple postcodes to improve the match rate
- To remove companies that have traditional office spaces in that building and are unlikely to be using flex spaces. This could be done manually (or potentially automated) by checking other data sources.
- Map Flex Space facilities to a master lookup list to standardise and simplify facilities and enable them to more easily be compared across providers and locations.
- Overlay additional data to analyse other factors that may contribute to location and occupants. For example:
- Flex space costs
- Accessibility / transport lines and hubs
- Talent pipeline / universities
- Amenities nearby
- Improve targeting pipeline list. Blend the with publicly available company data and news, to identify high-growth companies that may need more space, more flexibility in spaces locations and/or traditional fixed contract office space. For example blend with:
- Financial performance data from Companies House to see which are profitable
- Investment data to understand which companies have had an injection of funding and are likely to grow
- Headcount data from LinkedIn to identify companies growing that may need more desks
- Identify companies most likely to move locations. Look at historical addresses for companies (these are listed publicly in Companies House records) to identify which companies or industries are more likely to move locations over time. These could be good companies to target for new space.


0 Comments